PROPOSAL
Disaggregation of Domestic Electricity Data
How much does our smart meter readings disclose about us?
Can we disentangle the oven from the washing machine from the kettle?
Can we identify demographics and behavior patterns from the stream of electricity data?
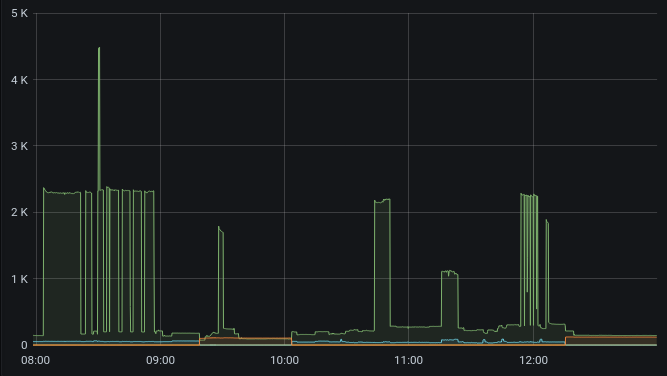
Most danish homes are now equipped so-called “smart meters” - networked electricity meters that report consumption and load at much higher rate than conventional meters. Currently the meters report data back to a centralized datahub on an hourly basis, but the meters are capable of producing data at a much higher granularity than this.
The meters in the greater Copenhagen area are of the type Kamstrup Omnipower, which include a HAN-slot that allows users to extract data at a much higher sampling rate, every 10 seconds. Humans can fairly easily spot repeating patterns in this rich data stream and infer the usage patterns. For machines this is more difficult. But if it can be done with some certainty it will allow for a potentially enormous extraction of information from our homes.
Techniques
This disaggregation task is often called Non-Intrusive Load Monitoring (NILM) and has been studied for a while. State-of-the-art models include Recurrent Neural Networks and Denoising Auto Encoders. Many of these and key metrics are implemented in the Open Source NILM Toolkit.
Data
At DasyaLab we have built a prototype IoT device that reads these measurements from the meters and sends them over MQTT to an external database, and have collected data from a couple of homes for around a year (~5,000,000 data points). The data contains intermittent outages and is not labelled.
Project ideas
This project would apply state-of-the-art NILM methods to our collected datasets, or to data from new installations.
While this proposal is data science oriented, it is also possible to focus on more hardware-oriented IoT aspects or UI/UX aspects.
Possible research questions:
- How much knowledge about a household can we extract using NILM techniques?
- How can we create labels for our dataset?
- Hand-labeling?
- Heuristics or weak supervision?
- Creating a interface so the user can label an event as it occurs?
- How important is sampling frequency to model performance?
- Compare to open access benchmark datasets
- How to design a system that could scale to all homes in Copenhagen?
Student profile
- Comfortable with Python
- Some experience with Machine Learning and/or Time Series Data, especially evaluation setups and metrics